
Throughout the last three months, 7 analysts have evaluated Acuity (NYSE:AYI), offering a diverse set of opinions from bullish to bearish.
Summarizing their recent assessments, the table below illustrates the evolving sentiments in the past 30 days and compares them to the preceding months.
| Bullish | Somewhat Bullish | Indifferent | Somewhat Bearish | Bearish | |
|---|---|---|---|---|---|
| Total Ratings | 1 | 4 | 2 | 0 | 0 |
| Last 30D | 1 | 3 | 1 | 0 | 0 |
| 1M Ago | 0 | 1 | 1 | 0 | 0 |
| 2M Ago | 0 | 0 | 0 | 0 | 0 |
| 3M Ago | 0 | 0 | 0 | 0 | 0 |
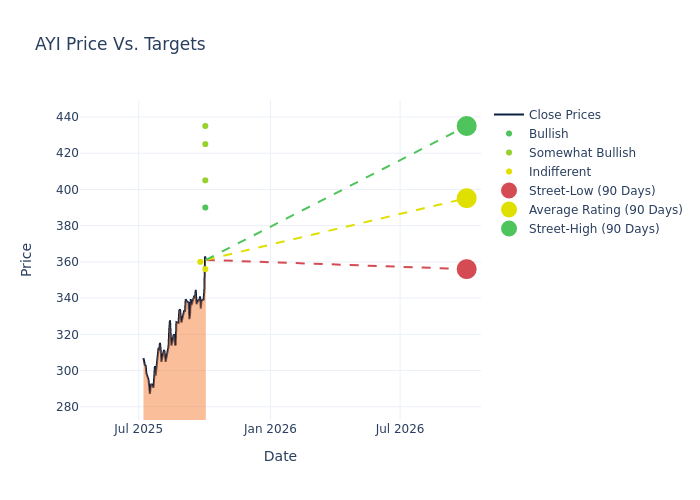
Insights from analysts' 12-month price targets are revealed, presenting an average target of $393.0, a high estimate of $435.00, and a low estimate of $356.00. This upward trend is evident, with the current average reflecting a 13.58% increase from the previous average price target of $346.00.
Interpreting Analyst Ratings: A Closer Look
A clear picture of Acuity's perception among financial experts is painted with a thorough analysis of recent analyst actions. The summary below outlines key analysts, their recent evaluations, and adjustments to ratings and price targets.
| Analyst | Analyst Firm | Action Taken | Rating | Current Price Target | Prior Price Target |
|---|---|---|---|---|---|
| Christopher Snyder | Morgan Stanley | Raises | Overweight | $425.00 | $365.00 |
| Brian Lee | Goldman Sachs | Raises | Neutral | $356.00 | $312.00 |
| Joseph O'Dea | Wells Fargo | Raises | Overweight | $405.00 | $380.00 |
| Jeffrey Osborne | TD Cowen | Raises | Buy | $390.00 | $330.00 |
| Christopher Glynn | Oppenheimer | Raises | Outperform | $435.00 | $380.00 |
| Timothy Wojs | Baird | Raises | Neutral | $360.00 | $335.00 |
| Joseph O'Dea | Wells Fargo | Raises | Overweight | $380.00 | $320.00 |
Key Insights:
- Action Taken: In response to dynamic market conditions and company performance, analysts update their recommendations. Whether they 'Maintain', 'Raise', or 'Lower' their stance, it signifies their reaction to recent developments related to Acuity. This insight gives a snapshot of analysts' perspectives on the current state of the company.
- Rating: Analysts unravel qualitative evaluations for stocks, ranging from 'Outperform' to 'Underperform'. These ratings offer insights into expectations for the relative performance of Acuity compared to the broader market.
- Price Targets: Analysts set price targets as an estimate of a stock's future value. Comparing the current and prior price targets provides insight into how analysts' expectations have changed over time. This information can be valuable for investors seeking to understand consensus views on the stock's potential future performance.
Navigating through these analyst evaluations alongside other financial indicators can contribute to a holistic understanding of Acuity's market standing. Stay informed and make data-driven decisions with our Ratings Table.
Stay up to date on Acuity analyst ratings.
Discovering Acuity: A Closer Look
Acuity is a leading industrial technology company that offers lighting, lighting controls, and intelligent building solutions. Acuity, Inc. designs, manufactures, and brings to market products and services relating to these and other offerings. Acuity, Inc. has two reportable segments: Acuity Brands Lighting and Acuity Intelligent Spaces. ABL sells commercial, architectural, and specialty lighting, including components and control systems. AIS offers building management and audio/visual solutions to help make buildings intelligent.
Financial Milestones: Acuity's Journey
Market Capitalization Analysis: Below industry benchmarks, the company's market capitalization reflects a smaller scale relative to peers. This could be attributed to factors such as growth expectations or operational capacity.
Revenue Growth: Acuity's remarkable performance in 3M is evident. As of 31 May, 2025, the company achieved an impressive revenue growth rate of 21.74%. This signifies a substantial increase in the company's top-line earnings. As compared to competitors, the company encountered difficulties, with a growth rate lower than the average among peers in the Industrials sector.
Net Margin: Acuity's net margin surpasses industry standards, highlighting the company's exceptional financial performance. With an impressive 8.35% net margin, the company effectively manages costs and achieves strong profitability.
Return on Equity (ROE): Acuity's ROE surpasses industry standards, highlighting the company's exceptional financial performance. With an impressive 3.86% ROE, the company effectively utilizes shareholder equity capital.
Return on Assets (ROA): Acuity's ROA excels beyond industry benchmarks, reaching 2.13%. This signifies efficient management of assets and strong financial health.
Debt Management: Acuity's debt-to-equity ratio is below the industry average at 0.42, reflecting a lower dependency on debt financing and a more conservative financial approach.
The Core of Analyst Ratings: What Every Investor Should Know
Experts in banking and financial systems, analysts specialize in reporting for specific stocks or defined sectors. Their comprehensive research involves attending company conference calls and meetings, analyzing financial statements, and engaging with insiders to generate what are known as analyst ratings for stocks. Typically, analysts assess and rate each stock once per quarter.
Some analysts publish their predictions for metrics such as growth estimates, earnings, and revenue to provide additional guidance with their ratings. When using analyst ratings, it is important to keep in mind that stock and sector analysts are also human and are only offering their opinions to investors.
If you want to keep track of which analysts are outperforming others, you can view updated analyst ratings along withanalyst success scores in Benzinga Pro.
Breaking: Wall Street's Next Big Mover
Benzinga's #1 analyst just identified a stock poised for explosive growth. This under-the-radar company could surge 200%+ as major market shifts unfold. Click here for urgent details.
This article was generated by Benzinga's automated content engine and reviewed by an editor.