
Macy's (NYSE:M) underwent analysis by 11 analysts in the last quarter, revealing a spectrum of viewpoints from bullish to bearish.
The table below offers a condensed view of their recent ratings, showcasing the changing sentiments over the past 30 days and comparing them to the preceding months.
| Bullish | Somewhat Bullish | Indifferent | Somewhat Bearish | Bearish | |
|---|---|---|---|---|---|
| Total Ratings | 1 | 0 | 9 | 0 | 1 |
| Last 30D | 0 | 0 | 1 | 0 | 0 |
| 1M Ago | 0 | 0 | 1 | 0 | 0 |
| 2M Ago | 1 | 0 | 6 | 0 | 1 |
| 3M Ago | 0 | 0 | 1 | 0 | 0 |
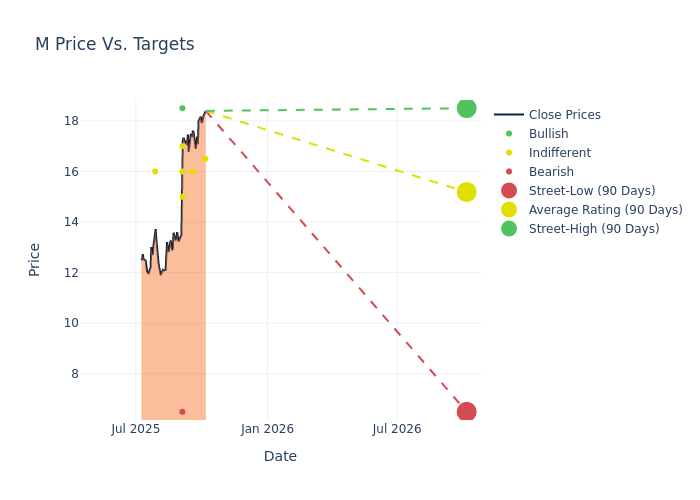
Analysts have recently evaluated Macy's and provided 12-month price targets. The average target is $14.91, accompanied by a high estimate of $18.50 and a low estimate of $6.50. Observing a 18.8% increase, the current average has risen from the previous average price target of $12.55.
Decoding Analyst Ratings: A Detailed Look
The analysis of recent analyst actions sheds light on the perception of Macy's by financial experts. The following summary presents key analysts, their recent evaluations, and adjustments to ratings and price targets.
| Analyst | Analyst Firm | Action Taken | Rating | Current Price Target | Prior Price Target |
|---|---|---|---|---|---|
| Brooke Roach | Goldman Sachs | Raises | Neutral | $16.50 | $14.50 |
| Alex Straton | Morgan Stanley | Raises | Equal-Weight | $16.00 | $12.00 |
| Brooke Roach | Goldman Sachs | Raises | Neutral | $14.50 | $13.00 |
| Paul Lejuez | Citigroup | Raises | Neutral | $16.00 | $12.00 |
| Paul Kearney | Barclays | Raises | Equal-Weight | $15.00 | $12.00 |
| Jay Sole | UBS | Raises | Sell | $6.50 | $6.00 |
| Dana Telsey | Telsey Advisory Group | Raises | Market Perform | $17.00 | $14.00 |
| Ashley Helgans | Jefferies | Raises | Buy | $18.50 | $14.50 |
| Dana Telsey | Telsey Advisory Group | Maintains | Market Perform | $14.00 | $14.00 |
| Dana Telsey | Telsey Advisory Group | Maintains | Market Perform | $14.00 | $14.00 |
| Matthew Boss | JP Morgan | Raises | Neutral | $16.00 | $12.00 |
Key Insights:
- Action Taken: Analysts adapt their recommendations to changing market conditions and company performance. Whether they 'Maintain', 'Raise' or 'Lower' their stance, it reflects their response to recent developments related to Macy's. This information provides a snapshot of how analysts perceive the current state of the company.
- Rating: Analysts unravel qualitative evaluations for stocks, ranging from 'Outperform' to 'Underperform'. These ratings offer insights into expectations for the relative performance of Macy's compared to the broader market.
- Price Targets: Analysts predict movements in price targets, offering estimates for Macy's's future value. Examining the current and prior targets offers insights into analysts' evolving expectations.
Capture valuable insights into Macy's's market standing by understanding these analyst evaluations alongside pertinent financial indicators. Stay informed and make strategic decisions with our Ratings Table.
Stay up to date on Macy's analyst ratings.
Discovering Macy's: A Closer Look
Founded in 1858 and based in New York City, Macy's operates about 450 stores under the Macy's name, nearly 60 stores under the Bloomingdale's (full-price and outlet) and Bloomie's names, and more than 170 freestanding Bluemercury specialty beauty stores. Macy's also operates e-commerce sites and licenses Bloomingdale's stores in the United Arab Emirates and Kuwait. Women's apparel, accessories, shoes, cosmetics, and fragrances constitute about 62% of Macy's sales.
Macy's: Financial Performance Dissected
Market Capitalization Perspectives: The company's market capitalization falls below industry averages, signaling a relatively smaller size compared to peers. This positioning may be influenced by factors such as perceived growth potential or operational scale.
Decline in Revenue: Over the 3M period, Macy's faced challenges, resulting in a decline of approximately -1.9% in revenue growth as of 31 July, 2025. This signifies a reduction in the company's top-line earnings. In comparison to its industry peers, the company trails behind with a growth rate lower than the average among peers in the Consumer Discretionary sector.
Net Margin: Macy's's net margin lags behind industry averages, suggesting challenges in maintaining strong profitability. With a net margin of 1.74%, the company may face hurdles in effective cost management.
Return on Equity (ROE): Macy's's ROE lags behind industry averages, suggesting challenges in maximizing returns on equity capital. With an ROE of 1.95%, the company may face hurdles in achieving optimal financial performance.
Return on Assets (ROA): Macy's's ROA is below industry standards, pointing towards difficulties in efficiently utilizing assets. With an ROA of 0.55%, the company may encounter challenges in delivering satisfactory returns from its assets.
Debt Management: Macy's's debt-to-equity ratio is notably higher than the industry average. With a ratio of 1.23, the company relies more heavily on borrowed funds, indicating a higher level of financial risk.
The Core of Analyst Ratings: What Every Investor Should Know
Benzinga tracks 150 analyst firms and reports on their stock expectations. Analysts typically arrive at their conclusions by predicting how much money a company will make in the future, usually the upcoming five years, and how risky or predictable that company's revenue streams are.
Analysts attend company conference calls and meetings, research company financial statements, and communicate with insiders to publish their ratings on stocks. Analysts typically rate each stock once per quarter or whenever the company has a major update.
Some analysts also offer predictions for helpful metrics such as earnings, revenue, and growth estimates to provide further guidance as to what to do with certain tickers. It is important to keep in mind that while stock and sector analysts are specialists, they are also human and can only forecast their beliefs to traders.
Which Stocks Are Analysts Recommending Now?
Benzinga Edge gives you instant access to all major analyst upgrades, downgrades, and price targets. Sort by accuracy, upside potential, and more. Click here to stay ahead of the market.
This article was generated by Benzinga's automated content engine and reviewed by an editor.