Top 3 Materials Stocks That Could Lead To Your Biggest Gains In October

Benzinga · 10/09 11:09
Share
Listen to the news
The most oversold stocks in the materials sector presents an opportunity to buy into undervalued companies.
The RSI is a momentum indicator, which compares a stock’s strength on days when prices go up to its strength on days when prices go down. When compared to a stock’s price action, it can give traders a better sense of how a stock may perform in the short term. An asset is typically considered oversold when the RSI is below 30, according to Benzinga Pro.
Here's the latest list of major oversold players in this sector, having an RSI near or below 30.
FMC Corp (NYSE:FMC)
- On Oct. 6, UBS analyst Joshua Spector maintained FMC with a Neutral and lowered the price target from $44 to $36, while Citigroup analyst Patrick Cunningham maintained the stock with a Neutral and cut the price target from $42 to $34. The company's stock fell around 18% over the past month and has a 52-week low of $30.15.
- RSI Value: 22.7
- FMC Price Action: Shares of FMC fell 2.5% to close at $30.34 on Wednesday.
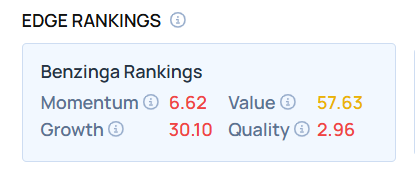
- Edge Stock Ratings: 6.62 Momentum score with Value at 57.63.
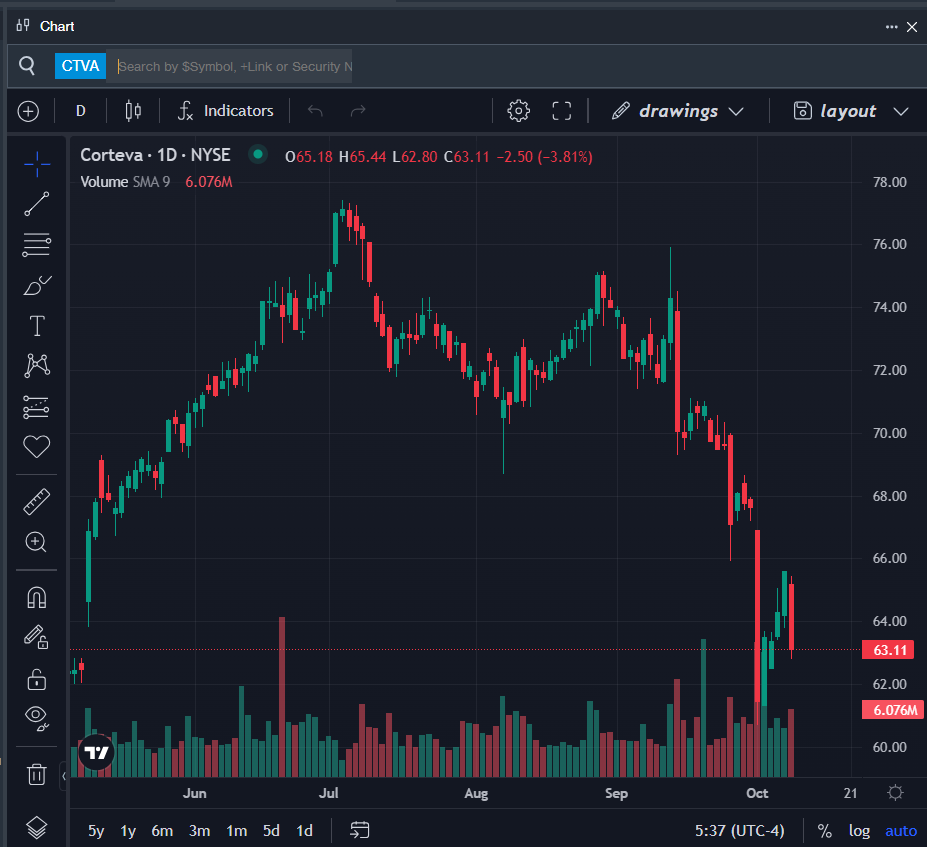
Corteva Inc (NYSE:CTVA)
- On Oct. 8, Mizuho analyst John Roberts maintained Corteva with an Outperform rating and lowered the price target from $85 to $78. The company's stock fell around 13% over the past month and has a 52-week low of $53.40.
- RSI Value: 29.8
- CTVA Price Action: Shares of Corteva fell 3.8% to close at $63.11 on Wednesday.
- Benzinga Pro’s charting tool helped identify the trend in CTVA stock.
Graphic Packaging Holding Co (NYSE:GPK)
- On Oct. 6, UBS analyst Anojja Shah maintained Graphic Packaging with a Neutral and lowered the price target from $24 to $20, while Citigroup analyst Anthony Pettinari maintained the stock with a Neutral and cut the price target from $23 to $21. The company's stock fell around 9% over the past month and has a 52-week low of $18.76.
- RSI Value: 25.9
- GPK Price Action: Shares of Graphic Packaging fell 1% to close at $18.79 on Wednesday.
- Benzinga Pro’s signals feature notified of a potential breakout in GPK shares.

Don't miss out on the full BZ Edge Rankings—compare all the key stocks now.
Read This Next:
Photo via Shutterstock
Disclaimer:This article represents the opinion of the author only. It does not represent the opinion of Webull, nor should it be viewed as an indication that Webull either agrees with or confirms the truthfulness or accuracy of the information. It should not be considered as investment advice from Webull or anyone else, nor should it be used as the basis of any investment decision.
What's Trending
No content on the Webull website shall be considered a recommendation or solicitation for the purchase or sale of securities, options or other investment products. All information and data on the website is for reference only and no historical data shall be considered as the basis for judging future trends.
Copyright © 2025 Webull. All Rights Reserved