
Icon (NASDAQ:ICLR) is set to give its latest quarterly earnings report on Wednesday, 2025-10-22. Here's what investors need to know before the announcement.
Analysts estimate that Icon will report an earnings per share (EPS) of $3.22.
The announcement from Icon is eagerly anticipated, with investors seeking news of surpassing estimates and favorable guidance for the next quarter.
It's worth noting for new investors that guidance can be a key determinant of stock price movements.
Earnings Track Record
In the previous earnings release, the company beat EPS by $0.10, leading to a 16.15% increase in the share price the following trading session.
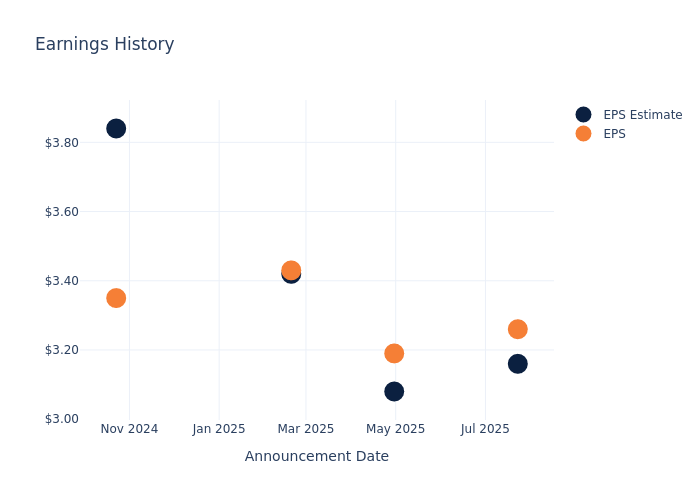
Here's a look at Icon's past performance and the resulting price change:
| Quarter | Q2 2025 | Q1 2025 | Q4 2024 | Q3 2024 |
|---|---|---|---|---|
| EPS Estimate | 3.16 | 3.08 | 3.42 | 3.84 |
| EPS Actual | 3.26 | 3.19 | 3.43 | 3.35 |
| Price Change % | 16.00 | -4.00 | 5.00 | -21.00 |
Icon Share Price Analysis
Shares of Icon were trading at $188.45 as of October 20. Over the last 52-week period, shares are down 31.13%. Given that these returns are generally negative, long-term shareholders are likely upset going into this earnings release.
Analyst Opinions on Icon
For investors, grasping market sentiments and expectations in the industry is vital. This analysis explores the latest insights regarding Icon.
With 11 analyst ratings, Icon has a consensus rating of Neutral. The average one-year price target is $215.27, indicating a potential 14.23% upside.
Peer Ratings Comparison
This comparison focuses on the analyst ratings and average 1-year price targets of Medpace Hldgs, Illumina and Tempus AI, three major players in the industry, shedding light on their relative performance expectations and market positioning.
- Analysts currently favor an Neutral trajectory for Medpace Hldgs, with an average 1-year price target of $446.45, suggesting a potential 136.91% upside.
- Analysts currently favor an Neutral trajectory for Illumina, with an average 1-year price target of $108.29, suggesting a potential 42.54% downside.
- Analysts currently favor an Buy trajectory for Tempus AI, with an average 1-year price target of $88.71, suggesting a potential 52.93% downside.
Peer Analysis Summary
The peer analysis summary presents essential metrics for Medpace Hldgs, Illumina and Tempus AI, unveiling their respective standings within the industry and providing valuable insights into their market positions and comparative performance.
| Company | Consensus | Revenue Growth | Gross Profit | Return on Equity |
|---|---|---|---|---|
| Icon | Neutral | -4.85% | $561.60M | 1.92% |
| Medpace Hldgs | Neutral | 14.24% | $180.01M | 23.57% |
| Illumina | Neutral | -4.77% | $695M | 10.16% |
| Tempus AI | Buy | 89.57% | $195.04M | -13.48% |
Key Takeaway:
Icon is positioned in the middle among its peers for consensus rating. It ranks at the bottom for revenue growth. In terms of gross profit, Icon is at the top among its peers. However, for return on equity, Icon is positioned at the bottom compared to its peers.
Unveiling the Story Behind Icon
Icon is a global late-stage contract research organization that provides drug development and clinical trial services to pharmaceutical, biotechnology, and medical-device firms. While the vast majority of its revenue comes from clinical research, Icon also offers ancillary services such as laboratory and imaging capabilities. The company is headquartered in Ireland.
Icon: Financial Performance Dissected
Market Capitalization: Indicating a reduced size compared to industry averages, the company's market capitalization poses unique challenges.
Decline in Revenue: Over the 3 months period, Icon faced challenges, resulting in a decline of approximately -4.85% in revenue growth as of 30 June, 2025. This signifies a reduction in the company's top-line earnings. As compared to competitors, the company encountered difficulties, with a growth rate lower than the average among peers in the Health Care sector.
Net Margin: Icon's net margin surpasses industry standards, highlighting the company's exceptional financial performance. With an impressive 9.07% net margin, the company effectively manages costs and achieves strong profitability.
Return on Equity (ROE): Icon's financial strength is reflected in its exceptional ROE, which exceeds industry averages. With a remarkable ROE of 1.92%, the company showcases efficient use of equity capital and strong financial health.
Return on Assets (ROA): Icon's financial strength is reflected in its exceptional ROA, which exceeds industry averages. With a remarkable ROA of 1.1%, the company showcases efficient use of assets and strong financial health.
Debt Management: Icon's debt-to-equity ratio is below the industry average. With a ratio of 0.37, the company relies less on debt financing, maintaining a healthier balance between debt and equity, which can be viewed positively by investors.
To track all earnings releases for Icon visit their earnings calendar on our site.
This article was generated by Benzinga's automated content engine and reviewed by an editor.