
Affiliated Managers Group (NYSE:AMG) is gearing up to announce its quarterly earnings on Monday, 2025-11-03. Here's a quick overview of what investors should know before the release.
Analysts are estimating that Affiliated Managers Group will report an earnings per share (EPS) of $5.86.
Investors in Affiliated Managers Group are eagerly awaiting the company's announcement, hoping for news of surpassing estimates and positive guidance for the next quarter.
It's worth noting for new investors that stock prices can be heavily influenced by future projections rather than just past performance.
Past Earnings Performance
In the previous earnings release, the company beat EPS by $0.12, leading to a 1.34% drop in the share price the following trading session.
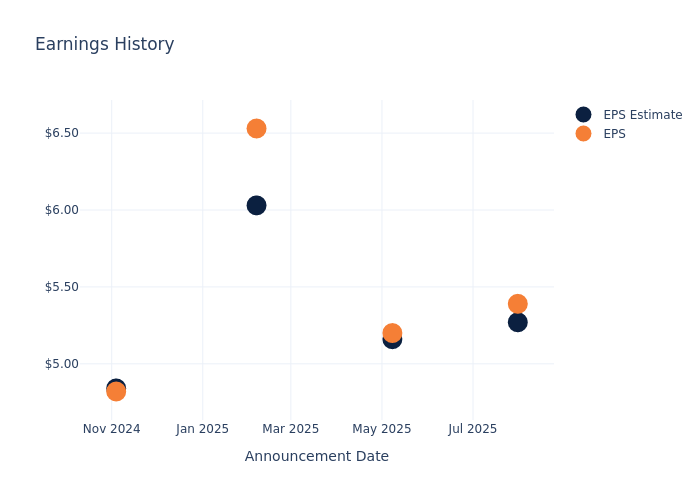
Here's a look at Affiliated Managers Group's past performance and the resulting price change:
| Quarter | Q2 2025 | Q1 2025 | Q4 2024 | Q3 2024 |
|---|---|---|---|---|
| EPS Estimate | 5.27 | 5.16 | 6.03 | 4.84 |
| EPS Actual | 5.39 | 5.20 | 6.53 | 4.82 |
| Price Change % | -1.00 | -1.00 | -2.00 | 0.00 |
Affiliated Managers Group Share Price Analysis
Shares of Affiliated Managers Group were trading at $236.68 as of October 30. Over the last 52-week period, shares are up 34.99%. Given that these returns are generally positive, long-term shareholders are likely bullish going into this earnings release.
Analyst Insights on Affiliated Managers Group
For investors, staying informed about market sentiments and expectations in the industry is paramount. This analysis provides an exploration of the latest insights on Affiliated Managers Group.
A total of 6 analyst ratings have been received for Affiliated Managers Group, with the consensus rating being Buy. The average one-year price target stands at $287.67, suggesting a potential 21.54% upside.
Comparing Ratings with Peers
In this comparison, we explore the analyst ratings and average 1-year price targets of Galaxy Digital, Janus Henderson Group and Hamilton Lane, three prominent industry players, offering insights into their relative performance expectations and market positioning.
- Analysts currently favor an Buy trajectory for Galaxy Digital, with an average 1-year price target of $42.82, suggesting a potential 81.91% downside.
- Analysts currently favor an Neutral trajectory for Janus Henderson Group, with an average 1-year price target of $48.8, suggesting a potential 79.38% downside.
- Analysts currently favor an Neutral trajectory for Hamilton Lane, with an average 1-year price target of $160.83, suggesting a potential 32.05% downside.
Peer Metrics Summary
The peer analysis summary provides a snapshot of key metrics for Galaxy Digital, Janus Henderson Group and Hamilton Lane, illuminating their respective standings within the industry. These metrics offer valuable insights into their market positions and comparative performance.
| Company | Consensus | Revenue Growth | Gross Profit | Return on Equity |
|---|---|---|---|---|
| Affiliated Managers Group | Buy | -1.42% | $229.50M | 2.62% |
| Galaxy Digital | Buy | 227.91% | $-44.95M | 30.90% |
| Janus Henderson Group | Neutral | 7.61% | $437.30M | 3.10% |
| Hamilton Lane | Neutral | -10.56% | $122.44M | 7.28% |
Key Takeaway:
Affiliated Managers Group ranks at the top for Gross Profit and Return on Equity among its peers. It is in the middle for Revenue Growth.
Discovering Affiliated Managers Group: A Closer Look
Affiliated Managers Group offers investment strategies to investors through its network of affiliates. The firm typically buys a majority interest in small to mid-size boutique asset managers, receiving a fixed percentage of revenue from these firms in return. Affiliates operate independently, with AMG providing strategic, operational, and technology support, as well as global distribution. At the end of June 2025, AMG's affiliate network—which includes firms like Abacus Capital and Pantheon dedicated to private markets (which accounted for 19% of AUM), AQR Capital and Capula Investment Management in liquid alternatives (24%), and Harding Loevner, Tweedy Browne, Parnassus, and Yacktman in equities, multi-asset, and bond strategies (57%)—had $771 billion in managed assets.
Understanding the Numbers: Affiliated Managers Group's Finances
Market Capitalization Perspectives: The company's market capitalization falls below industry averages, signaling a relatively smaller size compared to peers. This positioning may be influenced by factors such as perceived growth potential or operational scale.
Revenue Growth: Affiliated Managers Group's revenue growth over a period of 3 months has faced challenges. As of 30 June, 2025, the company experienced a revenue decline of approximately -1.42%. This indicates a decrease in the company's top-line earnings. In comparison to its industry peers, the company trails behind with a growth rate lower than the average among peers in the Financials sector.
Net Margin: Affiliated Managers Group's net margin is below industry averages, indicating potential challenges in maintaining strong profitability. With a net margin of 17.09%, the company may face hurdles in effective cost management.
Return on Equity (ROE): The company's ROE is below industry benchmarks, signaling potential difficulties in efficiently using equity capital. With an ROE of 2.62%, the company may need to address challenges in generating satisfactory returns for shareholders.
Return on Assets (ROA): Affiliated Managers Group's ROA falls below industry averages, indicating challenges in efficiently utilizing assets. With an ROA of 0.96%, the company may face hurdles in generating optimal returns from its assets.
Debt Management: The company maintains a balanced debt approach with a debt-to-equity ratio below industry norms, standing at 0.81.
This article was generated by Benzinga's automated content engine and reviewed by an editor.